Yep, you read that right. Visual Studio isn’t the first thing you think of when you hear “data science”, but that may just change soon. In Visual Studio 2017 they have included several tools together where you can do Python, R, and F# data projects for analysis and visualizations.
In this post we’ll go over how to use Python that you can get with Visual Studio and all the tools that you can use that comes with it.
Installing the Tools
First thing’s first, you need the tools before you can use them. You can go this with Visual Studio Community Edition, which is free to use, so no MSDN subscription or anything is required to get started.
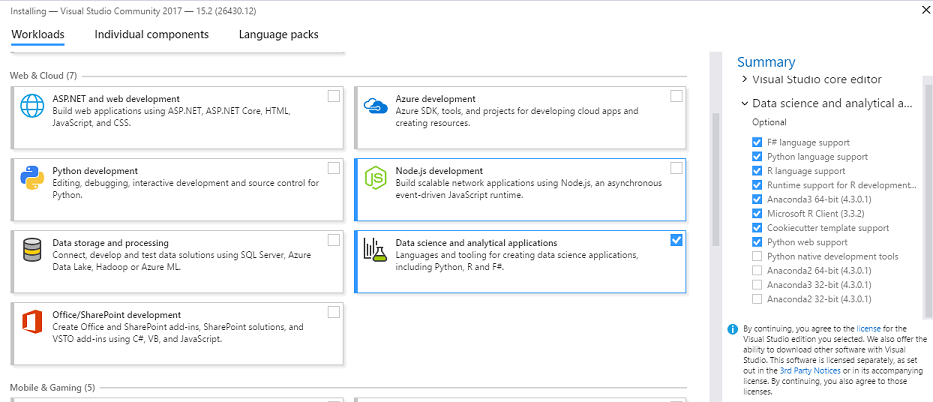
When you run the downloaded installer, just make sure you check the Data Science and Analytical Applications section:

After installing, you now have access to quite a few more project templates to choose from.

That’s a good amount! Let’s go through a bit of each of the Python and R templates and see what all they give us.
Python Projects
Here’s what the current list of Python templates look like.

That’s a lot of templates! A few of them are from the web side, such as Flask, Django, and Bottle, but not too much left. IronPython is the version that can be integrated into .NET projects. So for regular python projects, just using the Python Application template is all you need.
So let’s do that. Let’s create a project with the Python Application template and see what we get.

Not too bad, but what’s this one part that says “Python Environments”? You may also have noticed a new tab by that name, too. Here’s what mine looks like:

This is how Visual Studio deals with virtual environments in python. What that does is to keep required dependencies for each project isolated. So if project 1 depends on a library with version X and project 2 depends on that same library with version Y, having a separate virtual environment for each project will keep those dependencies isolated so they don’t interfere with the other project. In Visual Studio you can easily switch between any virtual environment at any time.
If you recall from the installation screenshot, you also get Anaconda which is a distribution of Python that includes all of the libraries bundled in to do data science and analytical programming, such as numpy and pandas.
Running Python Code
With that, let’s do some python! I’m just going to create a very simple function and print out the result.
def multiply(a, b):
    return a * b

print(multiply(5, 5))
Just hit “Run” and you can see your code run in all it’s glory!

Remember, though, you are in Visual Studio so you can definitely debug your code as well with breakpoints.

For more on learning the Python language, Wintellect has a couple of great webinars for you.
REPL
Would you rather run your code through the REPL instead of always clicking on “Run”? Visual Studio has read your mind! To bring it up go to View -> Other Windows and you will find the Python Interactive. You can type in any Python code that you want or you can highlight any code from a file you’re working in and hit Ctrl+Enter to send it to the interactive.

Also notice that you can tell the interactive what virtual environment you want it to use. The interactive will have access to any packages that environment has.
Jupyter Notebooks
One of the awesome things that the Python community has done was to create what’s called a Jupyter Notebook, or IPython Notebook. This lets you interweave executable Python code, text, and even visualizations. Visual Studio has some support for Jupyter Notebooks, but for now, I would suggest keeping with the original. How do you do that? You actually get it when you included Anaconda in the Visual Studio install! In a terminal just type jupyter notebook and it will launch a browser where you can navigate to any Jupyter Notebook that you have on your machine to edit and run it.
Visualizations
It’s hard to be able to do any kind of data science without being able to have visualizations of the data. Visual Studio can do this, as well! Take this simple snippet that uses matplotlib to display a bar chart:
from matplotlib import pyplot as plt

x = [1, 2, 3, 4, 5]

y = [2, 4, 1, 9, 3]

plt.bar(x, y)

plt.show()
Now that looks like a graph worthy of a presentation!
The Visual Studio team has done a lot of work to get so many Python tools integrated. From the templates to being able to debug Python code. I can definitely see Visual Studio as a contender as a leading tool for data science.
Are you more of an R developer? Don’t worry, in our next post we’ll go over using R in Visual Studio.
Do you have a Data Science or Python project?
Data Science & AI Consulting Data Science & Python Training